The Client & Clinician Supervision Dashboard
Last updated: August 26, 2026
The Client & Clinician Supervision dashboard is your single place to confirm every client and clinician is getting enough supervision to stay compliant. It tracks two BACB targets side by side — 10% supervision of each client's direct therapy hours, and 5% supervision of each RBT / Student Analyst's worked hours — and flags who is behind before it becomes a problem.
Open the dashboard
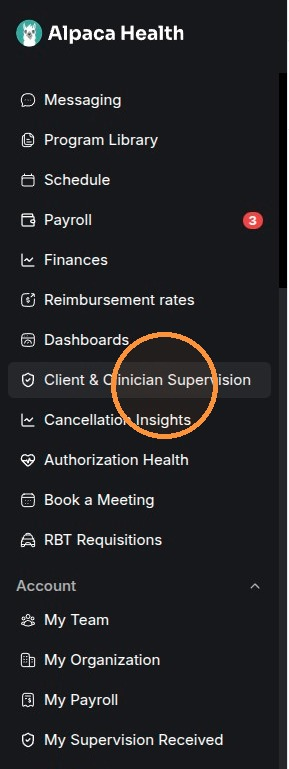
In the left sidebar, click Client & Clinician Supervision (it sits between Dashboards and Cancellation Insights).
The dashboard opens on the current organization and defaults to This month.
The organization name shows at the top; use the org switcher only if you manage more than one.
Read the top summary
The band across the top gives you the whole-org picture before you dig into any one person:
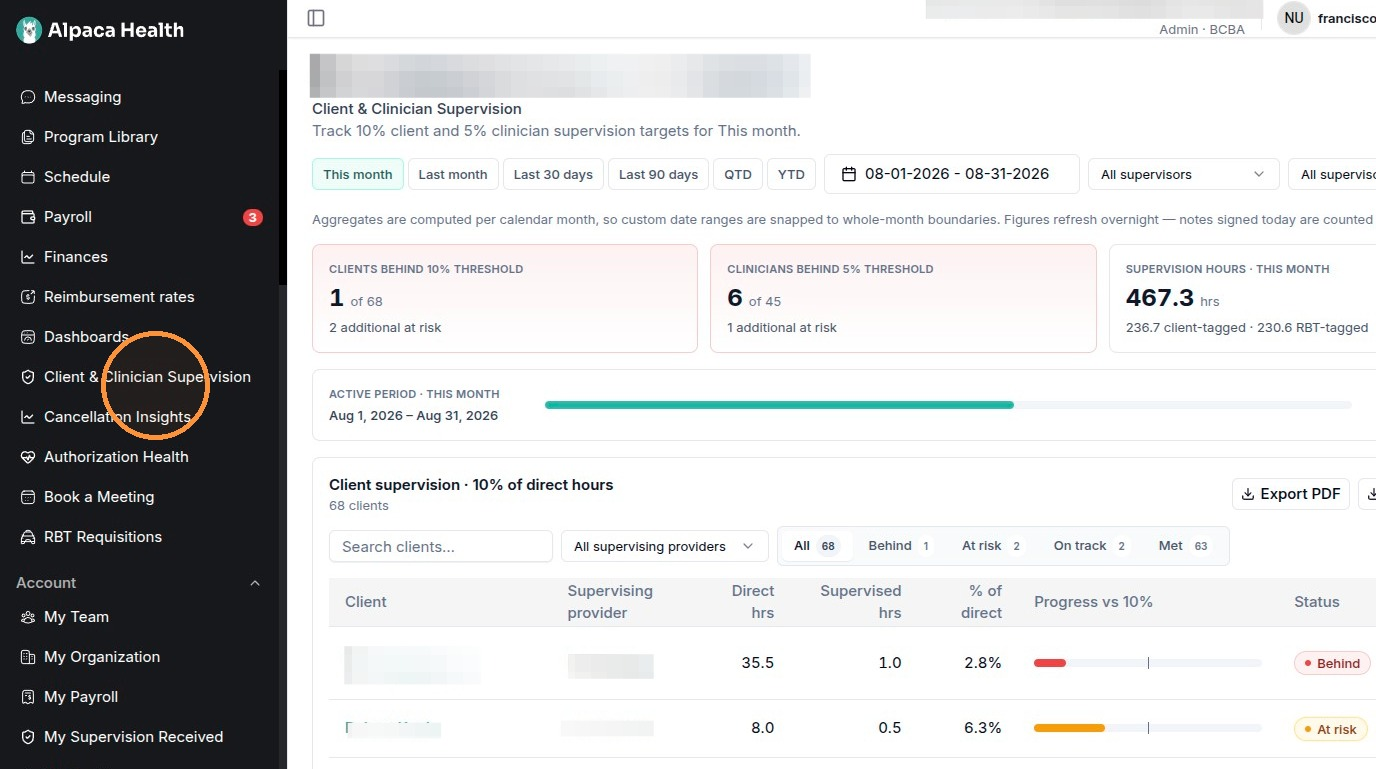
Clients behind 10% threshold — how many clients are below the 10% target (e.g. "1 of 68"), plus how many are "additional at risk."
Clinicians behind 5% threshold — same idea for RBTs / Student Analysts against the 5% target.
Supervision hours (this period) — total supervision hours logged, split into client-tagged vs RBT-tagged.
Active period — the calendar month being measured, with a progress bar. Past periods are marked Closed.
Note: Two targets, don't mix them up: 10% applies to CLIENTS (supervision as a share of direct therapy hours); 5% applies to CLINICIANS (supervision as a share of hours worked). Each has its own table lower on the page.
The top of the dashboard: date-range pills, filters, the three summary tiles, and the Active period bar.
Section 1 — Client supervision (10% of direct hours)
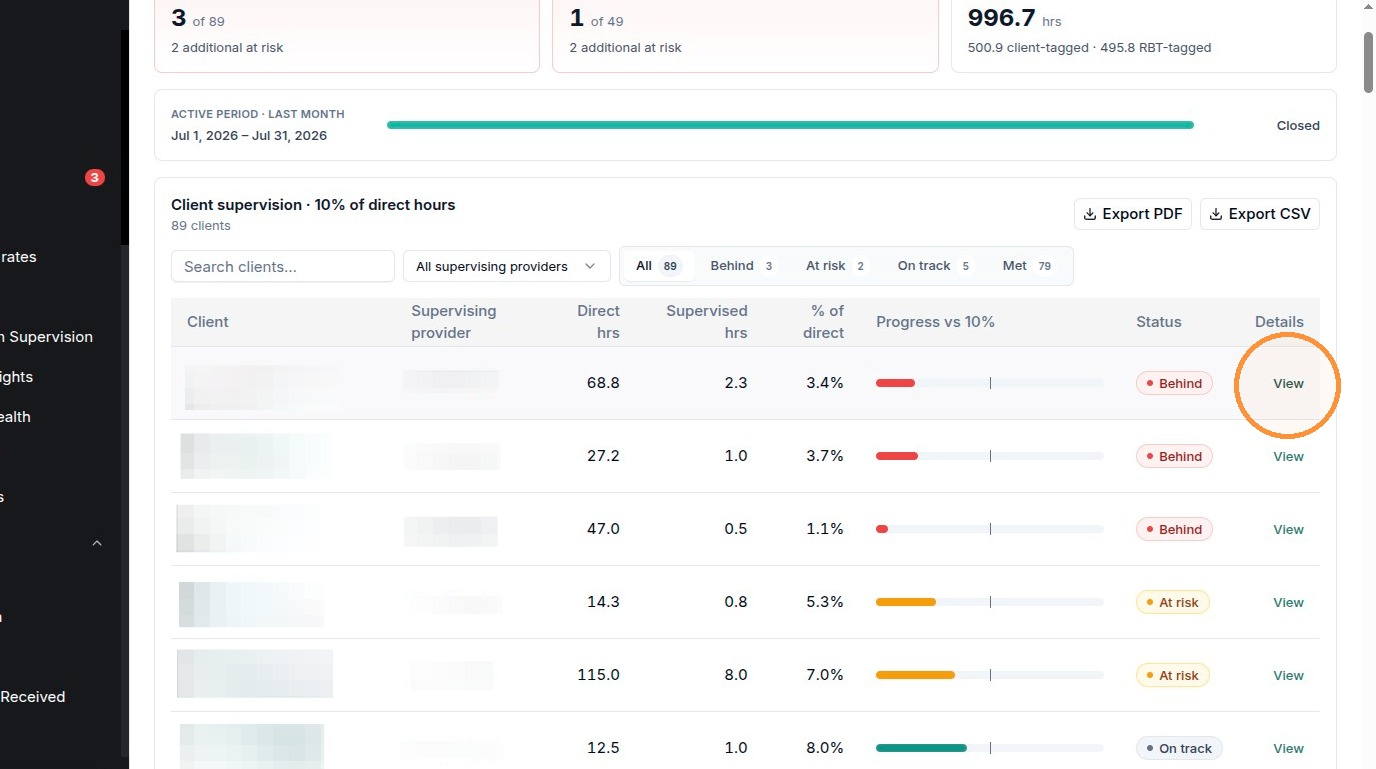
The first table lists every client and whether their supervision is keeping pace with 10% of their direct therapy hours.
What the status pills mean:
Behind (red) — already below the 10% target for this period.
At risk (yellow) — trending to miss the target if nothing changes.
On track (green outline) — pacing to hit 10%.
Met (green) — target already reached.
No data (gray) — no direct hours logged yet, so nothing to measure.
Narrow the list with the controls just above the table:
Search clients — type a name.
All supervising providers — filter to one BCBA's caseload.
Status tabs — All / Behind / At risk / On track / Met, each showing a count.
Drill into one client
Click View on any client row to open their detail page:
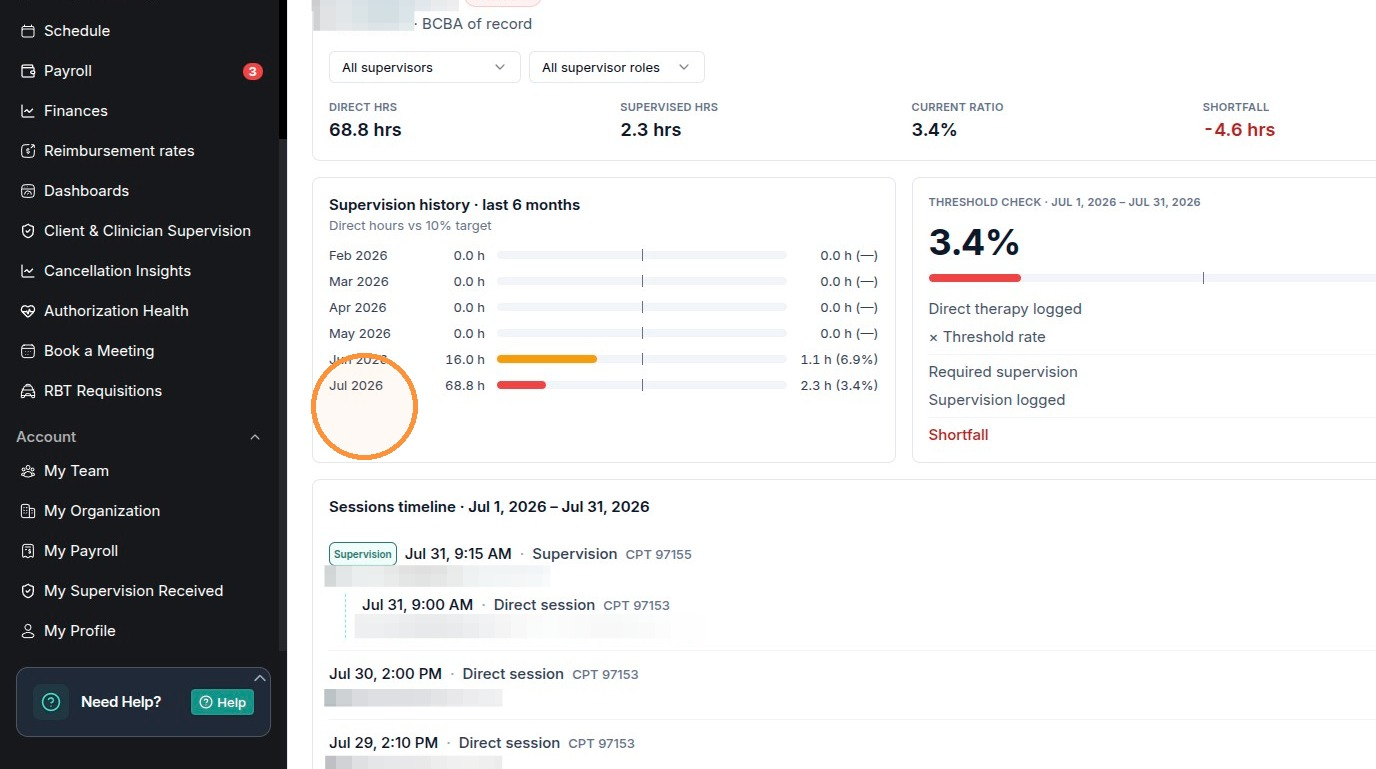
Top ratios — Direct hrs, Supervised hrs, Current ratio, and Shortfall (shown in red when hours are still owed).
Supervision history · last 6 months — a month-by-month bar of direct hours vs the 10% target.
Threshold check — the current ratio broken down: direct therapy logged, required supervision, supervision logged, and any shortfall.
Sessions timeline — every session in the period. Supervision sessions carry a green "Supervision" tag (CPT 97155) and show the direct session they supervised (CPT 97153) nested beneath.
Use the All supervisors and All supervisor roles dropdowns on this page to see who provided the supervision.
Section 2 — RBT & Student Analyst supervision (5% of working hours)
Scroll down to the second table. It measures each clinician's supervision against 5% of the hours they worked — the BACB monthly requirement. It works like the client table with a few different columns:
Clinician — name, role tag (RBT or BT), and how many clients they carry.
Supervisors — the BCBA(s) supervising them, with hours supervised.
Worked hrs / Supervised / % of worked — worked hours, supervision received, and the ratio measured against 5%.
Progress vs 5% and Status — same pills as the client table (Behind, At risk, On track, Met, No data).
View — opens that clinician's supervision detail and session timeline.
Review a past period
Use the date pills near the top: This month, Last month, Last 30 days, Last 90 days, QTD, YTD — or open the calendar to pick a custom range.
Custom ranges snap to whole calendar months, because every figure is computed per calendar month.
A past period shows Closed on its Active period bar.
Note: Figures refresh overnight — a note you sign today is counted tomorrow. Only SIGNED session notes count toward supervision; drafts and unsigned notes are excluded. If a number looks low, check for unsigned notes first.
Filter the whole dashboard
All supervisors (top-right dropdown) — limit both tables to supervision delivered by one person.
All supervisor roles (top-right dropdown) — limit by the supervisor's role.
These sit next to the date range and apply across the page; the per-table search and status tabs stack on top of them.
Export the data
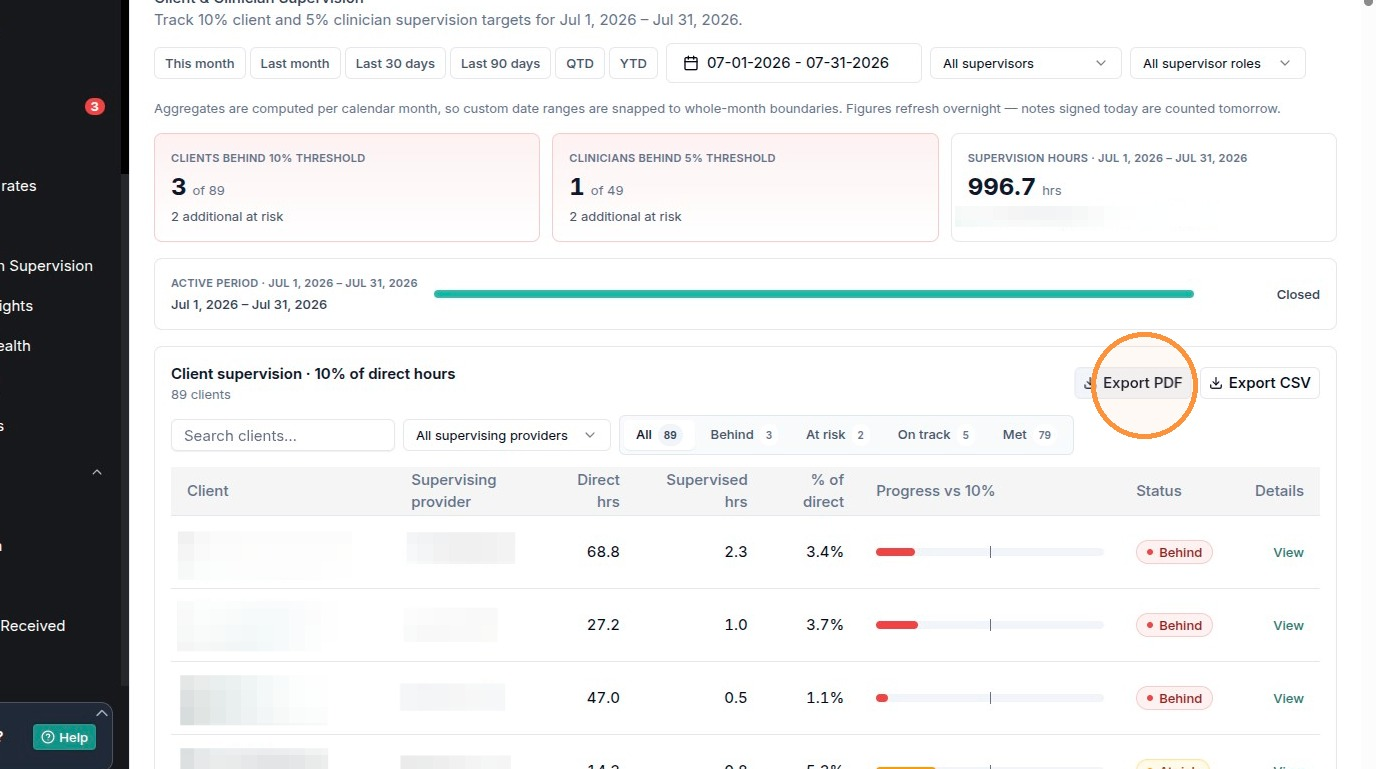
Each table has its own Export PDF and Export CSV buttons on the right of its header.
Export reflects your current filters and date range — set those first.
Use PDF for a shareable snapshot; use CSV to work the numbers in a spreadsheet.
Each table's Export PDF and Export CSV buttons sit on the right of its header.
Quick FAQs
What's the difference between the 10% and 5% targets? The 10% target is per client — supervision as a share of that client's direct therapy hours. The 5% target is per clinician — supervision as a share of the RBT / Student Analyst's worked hours (the BACB monthly requirement).
I signed a note today but the numbers didn't move — why? Figures refresh overnight, so today's signed notes appear tomorrow. Also confirm the note is signed; drafts and unsigned notes never count.
Can I pull this for our records or for an audit? Yes. Set your date range and filters, then use Export PDF for a snapshot or Export CSV for the raw numbers — each table exports separately.