Progress charts
Last updated: August 21, 2026
How to read your child's progress in the Alpaca Health parent portal: open the Charts page, find the right program, and understand the graph — including how to switch targets, change the time period, and read phase-change markers.
Overview
The Charts page turns the data collected in your child's sessions into graphs you can follow over time. It lives in the left menu under Patient Progress, alongside Schedule and Session Notes. This article shows how to find a program and make sense of its graph. (The raw numbers behind a single session live on the Collected Data tab of that session's note; Charts is where you see the trend across many sessions.)
1. Open the Charts page
Step 1. In the left menu, under Patient Progress, click Charts. If you have more than one child, first pick the right one from the tabs across the top of the page — the charts always reflect the child whose tab is selected.
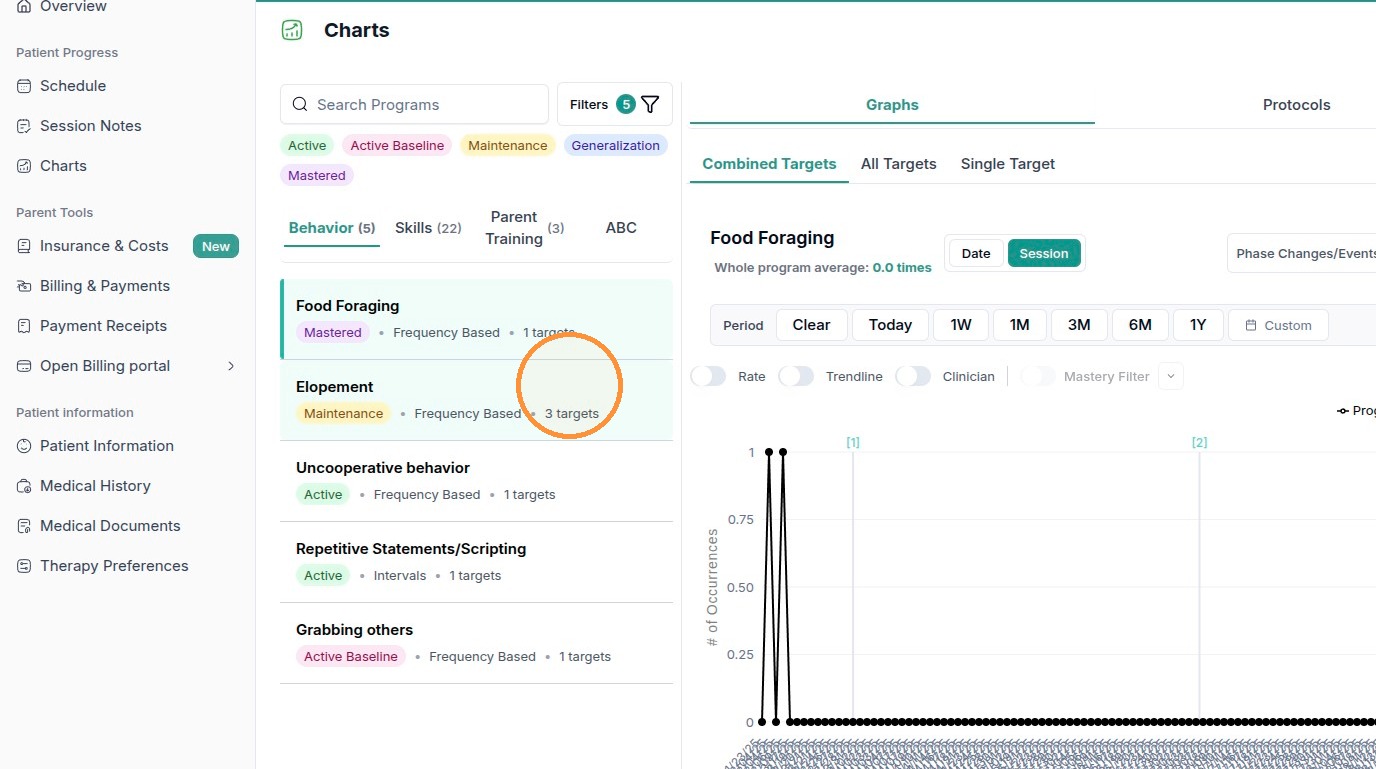
The Charts page. The left column is the list of programs (with search and filters); the right column is the graph for whichever program you select.
2. Find the program you want
Programs are listed down the left side. There are a few ways to narrow the list:
Search — type in the “Search Programs” box at the top of the list.
Categories — the tabs above the list group programs into Behavior, Skills, Parent Training, and ABC. The number next to each (for example, “Skills (22)”) is how many programs are in that category.
Status filters — click Filters to show or hide programs by status: Active, Active Baseline, Maintenance, Generalization, and Mastered. The number on the Filters button is how many filters are currently applied.
Each program in the list shows its name, a status badge (such as Active, Maintenance, or Mastered), the kind of data it collects (for example, Frequency Based or Intervals), and how many targets it has.
Step 1. Click a program to graph it. Its graph opens in the right-hand column.
3. Read the graph
The right-hand column shows the selected program's graph. A few controls decide what you're looking at:
Graphs vs Protocols — the two tabs at the top of the column. Graphs is the chart; Protocols is the written plan for the program.
Combined Targets / All Targets / Single Target — how the targets in the program are drawn. Combined Targets rolls them into one line (you'll see a “whole program average” above the chart); All Targets draws every target together; Single Target focuses on just one.
The chart itself — the vertical axis is the measure being tracked (for example, “# of Occurrences”), and each point is a session or a date along the bottom.
NOTE Numbered markers on the chart (for example, [1] and [2]) are phase-change / event lines. They mark points where something about the program changed — a new phase, a protocol change, or a noted event — so you can see progress in context.
4. Change the view and time period
Step 1. Switch the horizontal axis between Date and Session. The Date / Session toggle controls whether the chart is spaced by calendar date or by session number.
Step 2. Pick a time range with the Period buttons. Choose Today, 1W, 1M, 3M, 6M, 1Y, or Custom to set your own dates. Use Clear to remove a range and see everything.
Step 3. Turn on extra layers with the toggles above the chart. Depending on the program you'll see options such as Rate, Trendline, Clinician (to split the data by who ran the session), and a Mastery Filter. There's also a “Phase Changes/Events” control for showing or managing those markers.
Frequently asked questions
Q: Where do the numbers in the charts come from?
A: From the data collected during your child's sessions. Each session's raw numbers appear on the Collected Data tab of that session's note; the Charts page graphs those results across many sessions so you can see the trend.
Q: What do the numbered markers on the graph mean?
A: They're phase-change / event lines. Each marks a point where the program changed — a new phase, a protocol update, or a noted event — which helps explain shifts you see in the line.
Q: What's the difference between Combined, All, and Single Target?
A: Combined Targets summarizes the whole program as one line (with a whole-program average). All Targets plots every target together so you can compare them. Single Target isolates one target on its own. Switch between them with the sub-tabs above the chart.
Q: Why don't I see a program I'm looking for?
A: It may be hidden by a filter or in another category. Clear the Filters, check the category tabs (Behavior, Skills, Parent Training, ABC), or type its name in “Search Programs.” Also confirm the correct child is selected in the tabs at the top of the page.